Healthier Than Imagined?
Time after time, the fiscal struggles of small private colleges are bursting into headlines.
Institutions from the College of New Rochelle in New York to Mills College in California have decided to lay off faculty members this year in the face of steep budget challenges. Others have taken more drastic steps, such as Marygrove College in Detroit, which last week announced plans to end its undergraduate programs and become a graduate-only institution after the fall semester.
The headlines come after a prominent 2015 prediction from Moody’s Investor Service of a coming uptick in the number of institutions closing, with small private colleges facing particular pressure. They also come as Harvard Business School professor Clayton Christensen continues to predict that as many as half of all American universities will close or go bankrupt within a decade or so. But some say the rhetoric about small private colleges’ struggles has grown overheated. In their opinion, the situation just isn’t as bad as it sounds.
Now, a new report from one of the country’s major associations of independent nonprofit colleges attempts to measure the financial health of small private institutions and how that health has changed since the turn of the century. The report, which is being released today by the Council of Independent Colleges, calculates several key financial metrics for a sample of 559 institutions of varying size and classification from across the country.
CIC leaders hope the report strikes a blow against the idea that large numbers of small and midsize private colleges are on the brink of financial ruin. Its findings reflect general strength in some financial areas — and show that individual institutions of all types and sizes can be financially healthy.
“We think the prevailing public view is wrong,” said Richard Ekman, CIC president. “We come up against this all the time. The best way to counter that perception, we believe, is to have good, reliable data. This study is drawn from all public sources of data. You can’t imply that we cooked the books.”
The report does, however, indicate that a group of the smallest private colleges — those with fewer than 1,000 students enrolled — have posted consistently weaker financial performance than larger peers through both good times and bad. It also indicates certain classifications of colleges — those with a Carnegie classification of baccalaureate arts and sciences institutions — have recorded better financial metrics over the years than their peers.
CIC officials maintain that their findings don’t reveal any single indicator of whether a college is likely to struggle financially.
“As the person who did the on-the-ground research for this, I was hoping for a clear result — this is the factor that determines whether an institution is financially resilient,” said Hollie Chessman, CIC director of research projects. “What you have in front of you is the true message: there’s a lot of different factors that come into play.”
Other experts said the report still supports the argument that some institutions are in trouble.
“People who think there’s information here which shows we are a resilient industry are perfectly defended,” said Kent John Chabotar, former president of Guilford College and founding partner of the higher education consulting firm MPK&D. “And those who believe that schools are going to gradually close will find ample evidence as well.”
Reading Ratios
CIC looked at 14 years of financial data, from the 2000-01 fiscal year through the 2013-14 fiscal year. Its sample of 559 private baccalaureate and master’s-level colleges and universities represents a majority of its member institutions. Data came from institutions’ Internal Revenue Service filings and the Department of Education’s Integrated Postsecondary Education Data System.
The report is based on a well-known set of metrics for analyzing higher education finances: a primary reserve ratio measuring the sufficiency of resources, a viability ratio gauging debt management, a return on net assets ratio measuring performance in endowment and investment returns, and a net operating revenues ratio measuring operating surpluses or deficits. The ratios were also combined into a marker of financial health called the composite financial index, or CFI. All of the ratios and the CFI have a recommended threshold for financial health.
CIC calculated sample institutions’ median performance and measured it over time. The medians over time of all four individual ratios and the CFI show colleges and universities hit hard during the Great Recession and recovering significantly since then — albeit to different degrees, and with some bumps along the way.
The primary reserve ratio has a financial health threshold of 0.4, which would mean a college had enough reserves to cover expenses for about 40 percent of its fiscal year without taking in additional revenue. The median primary reserve ratio for CIC’s sample colleges and universities fell below that line in 2008-09, dropping to 0.37 amid falling expendable net assets. But it recovered afterward, rising above 0.6 in 2013-14.
.JPG)
A viability ratio of 1.0 means that expendable funds equal long-term debt. Viability ratios generally should come in above 1.25, a level judged to show expendable funds are adequate to manage debt. But the median viability ratio in the CIC report’s sample has not been above that cutoff since 2000-01. It fell sharply from 2006-07 to 2008-09, bottoming out at about 0.6 before climbing back up in recent years. It remained below the 1.25 threshold in 2013-14.
That shows institutions haven’t had sufficient expendable funds to adequately manage their debt since 2000-01, the report says. It goes on to note that some institutions took on debt during the recession, using low interest rates as a way to cheaply finance new buildings or the addition of academic programs.
.JPG)
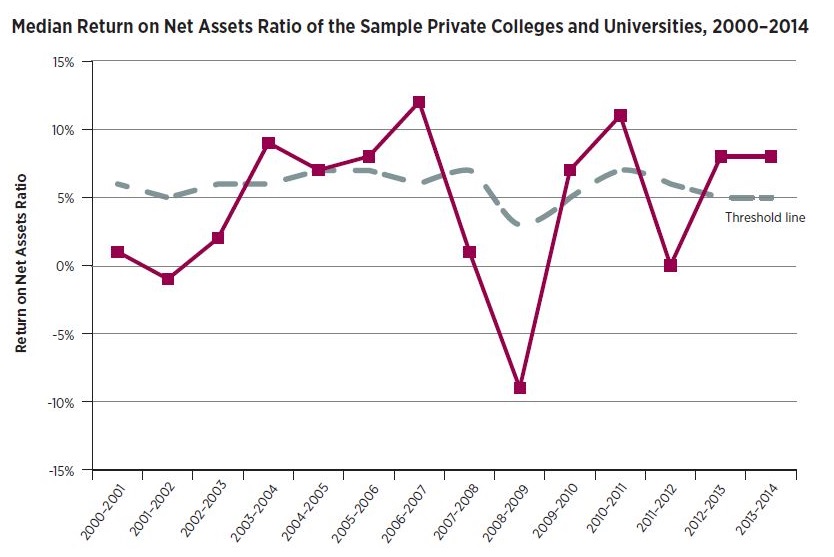
The return on net assets ratio is recommended at 3.5 percentage points above inflation — a level considered to show a sufficient return for endowments and other assets. Institutions’ return on net assets ratio fluctuated significantly over the study’s time period as the financial markets have gone through their ups and downs. CIC — and many in the investment world — argue this ratio is best measured over time to account for year-to-year volatility and institutions’ needs to invest some years and grow assets in other years.
The median return on net assets ratio finished above the threshold line in the two most recent years covered by the report. It’s worth noting, however, that other data have shown college and university endowment returns falling in 2015 and 2016.
A net operating revenues ratio of 4 percent is considered to show colleges and universities living within their means. Like many of the other ratios, the median net operating revenues ratio bottomed out in the harsh economic climate of 2008-09 before recovering. It also dipped below its 4 percent threshold in 2011-12 before coming in above the line in the two subsequent years.
.JPG)
The four ratios shown above were weighted before being combined into the CFI. The primary reserve ratio and viability ratio were each weighted at 35 percent. The return on net assets ratio was weighted at 20 percent, and the net operating revenues ratio was weighted at 10 percent.
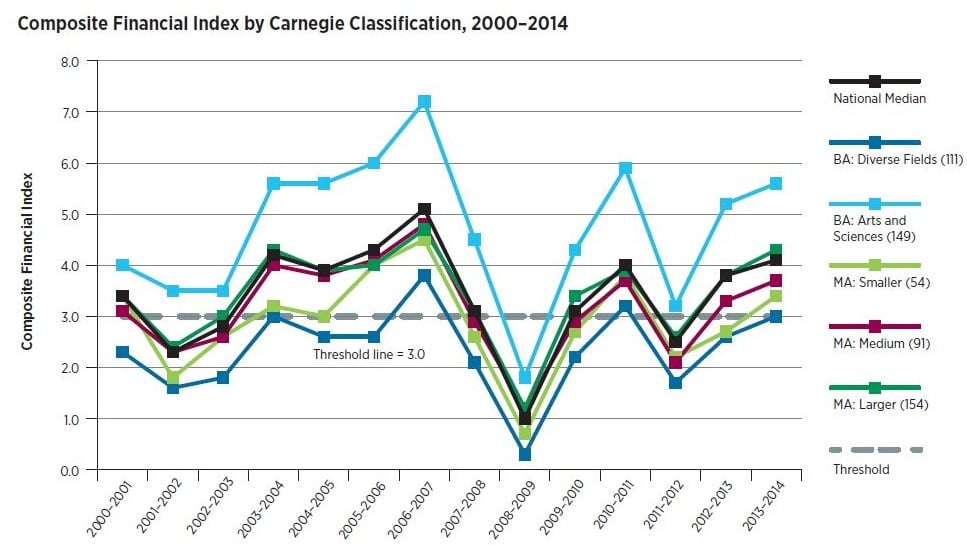
The threshold for a healthy CFI is considered to be 3.0. A review of the median CFI over the study’s 14 years shows a massive drop during the recession bottoming out in 2008-09, followed by recovery, a dip below the threshold line in 2011-12, and a settling in above the line in the two most recent years studied.
.JPG)
The median of all institutions in the study don’t tell the story for each individual college, of course. The report says that 88 percent of the colleges in its sample had maintained or improved their CFI scores over the course of the 14 years examined. It adds that 67 percent of colleges and universities were at or above the CFI threshold in the most recent year analyzed.
Some observers weren’t convinced those statistics show overwhelming strength among private colleges, however.
“Two-thirds of the schools meet the financial viability ratios,” said Douglas Webber, an associate professor in Temple University’s economics department. “That means that a third of schools don’t, which is kind of striking.”
Small Colleges Struggle
The report goes on to slice CFI results by institutional characteristics. It found unsurprising results when breaking institutions down by financial resource level — the poorest institutions posted the lowest CFI scores.
.JPG)
More interesting results came from looking at CFI by Carnegie classification and enrollment size. The 149 institutions with a Carnegie classification of baccalaureate arts and sciences institutions consistently outperformed other classes of institution. The 111 with a classification of baccalaureate diverse fields struggled to break the CFI threshold on a consistent basis.
CIC noted that baccalaureate arts and sciences institutions tend to be highly selective and wealthy with clear missions. Baccalaureate diverse fields institutions have a wider range of programs and include professional programs. They often have lower endowments, are less selective when offering students admission and rely more on tuition to meet their budget demands.
“Those colleges that have remained pretty pure in their curriculum also happen to be the ones who are pretty affluent and selective,” Ekman said.
Meanwhile, those with fewer than 1,000 full-time-equivalent students regularly underperformed those with larger enrollments.
.JPG)
Many feel it is important to emphasize that the institutions with the smallest enrollments posted the lowest financial performance.
“The colleges that are struggling the most are the ones with fewer than 1,000 students, which matches up pretty well with the colleges that have either closed or have been threatening closure,” said Robert Kelchen, an assistant professor of higher education at Seton Hall University.
Even so, the analysis does not show that smallness is a predictor of financial weakness or health, said Hal Hartley, CIC senior vice president.
“What you find are institutions, and not just one or two, but a significant number, that beat those kinds of generalizations,” he said.
Also noteworthy was that institutions with 2,001 to 3,000 full-time equivalent students consistently posted the highest CFI scores. That runs against the idea that the largest institutions are the most financially stable.
CIC pointed to small institutions including Nebraska Wesleyan University as examples of organizations that can be financially healthy even in difficult circumstances. The university’s president, Frederik Ohles, said the study shows that as higher education is challenged, most institutions are working to adapt.
“Most of us are working hard and responding to the challenge, and the financial results are reasonably good,” said Ohles, who is a senior adviser to CIC’s presidential vocation and institutional mission program. Nebraska Wesleyan uses some of the same ratios highlighted in the CIC report as metrics to show to its university Board of Governors, Ohles said.
The university, which typically enrolls about 1,500 traditional undergraduates along with another 500 to 600 adult and graduate students, saw its net tuition per student fall and then recover after the recession, Ohles said. Student revenue accounts for 90 percent of the university’s operating budget, making it a good example of a tuition-dependent institution.
Nebraska Wesleyan just finished its 2017 fiscal year with a surplus of 2 percent on a $40 million operating budget. It has discontinued some master’s programs and added others in the last several years and tried to refinance long-term debt when it was advantageous.
“We have effective budget discipline,” Ohles said. “That’s kept us out of difficulties.”
Another small institution reporting budget surpluses is New England College in New Hampshire. The college posted an operating surplus of about $800,000 last year on an operating budget of $57 million, according to Michele Perkins, New England College’s president. It anticipates growing that surplus to $1 million in the 2018 fiscal year.
The college wants to grow its traditional residential undergraduate enrollment from an expected 1,060 this fall to 1,500, said Perkins, who formerly served on CIC’s Board of Directors. Its residential undergraduate program doesn’t currently generate a surplus — the institution’s surplus is driven by other programs, like online education and graduate programs, which push total enrollment to about 2,700. Traditional undergraduate programs would break even at about 1,300 students, the college estimates.
To grow, New England College will have to fight against projections of declines in the number of high school graduates in the Northeast. It’s started recruiting in secondary markets like the mid-Atlantic, and Perkins emphasizes that it has a diverse student body.
Over the years, the college has kept its debt levels low, left some faculty positions unfilled and offered voluntary retirements, Perkins said. The college has strengthened its financial standing, she said.
“We’re much less fragile than we were 15 years ago,” she said. “Necessity is the mother of invention, and we learned to be very frugal in our budget, and we learned to be resourceful and creative.”
The stories of small colleges and universities successfully navigating budget pressures contrast with those of institutions that have been unable to bring their finances under control. For example, last week when Marygrove College announced its decision to end undergraduate enrollment, it did so after trying to control its budget for years.
The college in Detroit thought it could balance its budget in 2014-15. Despite cutting expenses by about 20 percent to $20 million, it still ran a $4 million deficit last year. The deficit came as enrollment plunged from 1,850 graduates and undergraduates in 2013 to fewer than 1,000 last fall.
“I need money, but I also need students,” Marygrove President Dr. Elizabeth Burns told Inside Higher Ed last week. “We need volume, and we need a lot of students in class.”
Gainers, Maintainers and Decliners
The CIC report includes another analysis of the way colleges’ and universities’ financial health has changed over time. It subtracted institutions’ average CFI scores from the 2000-04 period from their average scores from the 2010-14 period. It classified those whose CFI scores increased by two points or more as “gainers,” those with scores dropping by two points or more as “decliners” and those in between as “maintainers.” It then removed any gainers from its analysis that did not post a CFI above the threshold of 3.0 in 2010-14. It removed decliners that did not post a CFI below 3.0.
The result is an analysis of 360 institutions. It evaluates colleges and universities whose financials improved or deteriorated to the point where they crossed the CFI threshold. It also evaluates those holding relatively steady. But it doesn’t reflect any movement among institutions that saw significant changes without crossing the key CFI threshold.
Those rules were intended to prevent mislabeling, according to Hartley. Unless the analysis was limited to only gainers and decliners crossing the CFI threshold, it would have been possible for an institution dropping from a high CFI score of 9.0 to a still-high score of 6.0 to have been labeled as a decliner. Such an institution would still have been in a very different ending financial situation than one that dropped from a CFI score of 4.0 to a score of 1.0.
A total of 104 institutions, 29 percent of the remaining sample, were labeled gainers. Another 213, or 59 percent, were labeled maintainers, and 43, or 12 percent, were labeled decliners. That means 199 institutions were thrown out of the analysis of gainers, decliners and maintainers. CIC did not provide data showing how many institutions would have fallen into each category without the CFI threshold requirements.
A full 40 percent of decliners in the analysis were institutions with an enrollment of fewer than 1,000 full-time equivalent students. Only 12 percent of decliners had enrollments of 2,001 to 3,000.
Yet there were still more institutions with enrollments under 1,000 labeled as gainers, 26, than as decliners, 17.
Meanwhile, 79 percent of all decliners were in either the third or fourth quartile when institutions’ financial resources were measured. More institutions in the fourth quartile were decliners, 15, than gainers, 12.
Only 5 percent of the 43 decliners were in the first quartile when institutions were split by their level of financial resources. Just 16 percent were in the second quartile.